This section contains carefully selected MCQs and Previous Year Questions with explanations to help students understand concepts and prepare effectively for examinations, interviews, and competitive tests.
Q: 1In context of software engineering, UML stands for:
Option C
UML stands for Unified Modeling Language, a standardized visual language used to model, design, and document software systems.
| UML DIAGRAM | TYPE | DESCRIPTION |
|---|---|---|
| Use Case Diagram | Behavioral | Represents the functional requirements of a system. It shows how users or external actors interact with the system to achieve specific goals. |
| Timing Diagram | Represents the behavior of objects over time, showing changes in state or conditions with respect to time. It is mainly used in real-time and embedded systems. | |
| Sequence Diagram | Illustrates how objects interact with each other in a time sequence. It shows the order of messages exchanged during a particular process. | |
| Activity Diagram | Models the flow of control or data from one activity to another. It is used to represent workflows and business processes. | |
| State Machine Diagram | Represents the different states of an object and the transitions between those states based on events. It is useful for modeling reactive systems. | |
| Component Diagram | Structural | Displays the organization and dependencies among various software components. It helps in understanding the implementation structure of the system. |
| Deployment Diagram | Describes the physical architecture of the system, showing hardware nodes and the software components deployed on them. | |
| Class Diagram | Describes the static structure of a system by showing classes, their attributes, operations, and the relationships among them. | |
| Object Diagram | Provides a snapshot of instances of classes (objects) and their relationships at a particular moment in time. It helps in understanding the system’s runtime behavior. | |
| Package Diagram | Groups related classes or elements into packages and shows dependencies among these packages. It helps in managing large-scale systems. | |
| Composite Structure Diagram | Shows the internal structure of a class and the collaborations among its parts. It helps in analyzing complex system components. |
Q: 2Which of the following UML diagram is a part of the behavioural view of a system?
I. Collaboration Diagram
II. Component Diagram
III. Use Case Diagram
Option A
In UML, diagrams are broadly divided into structural and behavioural views.
Collaboration Diagrams (Communication Diagrams) are explicitly behavioural diagrams that show object interactions and message passing.
Q: 3UML stands for:
Option A
UML is a standardized modeling language used for visualizing, specifying, constructing, and documenting software systems.
Q: 4In a DFD, a circle represents:
Option B
In DFD (Data Flow Diagram), the circle represents processes that transform input data into output data.
Q: 5CASE tools are mainly used to:
Option B
CASE (Computer-Aided Software Engineering) tools automate various stages like analysis, design, coding, and testing.
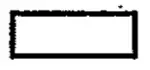
Q: 6Which of the following are represented by the box icons divided into horizontal parts in UML class diagrams?
Option D
In Unified Modeling Language (UML), classes, abstract classes, and interfaces are depicted using Rectangular Boxes divided into three horizontally into compartments.
This standardized box notation applies to classes, abstract classes (often italicized names), and interfaces (sometimes labeled with «interface»).
| Student |
| name : String rollno : int |
| setDetails() : void getDetails() : void updateRecord() : void |
| Employee |
| empID: int salary: float |
| calculateBonus() : void |
| «interface» Drawable |
| Interfaces typically do not have attributes. |
| draw() : void resize() : void |
Q: 7Which symbol in Data Flow Diagrams represents Data Store?
.webp)
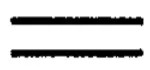

Option B
In a Data Flow Diagram (DFD), different symbols are used to show how data moves within a system. A Data Store is a place where data is kept for later use. It could be a file, a database table, a ledger, or any storage location. To represent this storage in a DFD, we use Two Parallel Horizontal Lines (Open-Ended Rectangle).
| DFD SYMBOL | USE |
|---|---|
| Process (Circle or Rounded Rectangle) | Shows an activity that transforms input data into output data. It represents work being done. |
| Data Flow (Arrow) | Represents the movement of data between entities, processes, and data stores. |
| External Entity (Rectangle / Square) | Represents a person, department, organization, or system outside the boundary of the current system that provides or receives data. |
| Data Store (Two parallel horizontal lines) | Represents a place where data is stored for later use, such as files, databases, or records. |
Q: 8Which UML diagram supports description of parallel activities and synchronization aspects involved in different activities?
Option B
In UML, an Activity Diagram is used to model workflows or processes and is the standard diagram for showing parallel activities and synchronization. It supports:
| Diagram Name | Description |
|---|---|
| Sequence Diagram | Shows time ordered message interactions between objects. |
| Activity Diagram | Models workflows and supports parallel activities (Forks) and synchronization (Joins), making it suitable for describing parallel activities and synchronization aspects. |
| Collaboration Diagram | Emphasizes object level collaboration and messages. |
| State Chart Diagram | Models state transitions of an object in response to events. |
Q: 9Which of the following is not a part of UML?
Option C
UML (Unified Modeling Language) is used to design and visualize software systems. It includes different types of diagrams to represent structure and behavior.
The Entity Relationship Diagram (ERD) is not part of UML. It is mainly used in database design to represent entities, attributes, and relationships.
Q: 10In the Model View Controller (MVC) architecture, which layer is defined by the Model?
Option C
In the Model View Controller (MVC) architecture, the application is divided into three parts:
The Model represents the business logic layer, where the core functionality, rules, and data processing of the application are defined.
Q: 11____________ is a program development tool used for specifying program logic.
Option C
A program flow chart is a development tool used to visually represent the step-by-step logic of a program. It uses standard symbols to show the flow of control, decisions, loops, inputs, outputs, and processing steps. This helps programmers design, understand, and debug program logic before writing actual code.
Q: 12A _____________ describes how a user interacts with the system by defining the steps required to accomplish a specific goal.
Option C
A Use Case Diagram describes how a user interacts with a system by defining the steps or scenarios required to accomplish a specific goal. It visually represents the actors and the use cases they perform with the system. This helps stakeholders understand system behavior from the user's perspective, facilitating requirement gathering and system design.
You have reached the end of this topic. Continue learning with the next topic below.
Thank you so much for taking the time to read my Computer Science MCQs section carefully. Your support and interest mean a lot, and I truly appreciate you being part of this journey. Stay connected for more insights and updates! If you'd like to explore more tutorials and insights, check out my YouTube channel.
Don’t forget to subscribe and stay connected for future updates.
| Student Name | |
|---|---|
| College |
| What's Say |
|---|